Use of GIS for assessing the changing risk of oil spills from tankers (2007)
23 May 2014
Colleen O'Hagan
Paper presented at 3rd Annual Arctic Shipping Conference, St Petersburg, Russia, 17-20 April 2007
Assessing the risk of oil spills from ships has long been of interest to the maritime industry. Many factors affect the frequency of accidental oil spills, including the amount of oil transported and the combined effect of local conditions. These local factors include weather and sea conditions, visibility, water depth, navigational hazards and nature of the sea bed, which vary both spatially and temporally, and are often unpredictable. It is therefore not possible to quantify the individual effect of each. The approach of this study is to use a GIS platform to model the amount of oil transported on a regional scale, thus facilitating the analysis of spatial/temporal variations and enabling the integration of site-specific data.
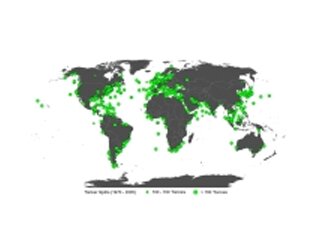
An initial study was carried out to provide a general overview of risk in the Regional Seas as defined by the United Nations Environment Programme (UNEP). The approach taken was to deduce the relative risk of spills in different locations by comparing the historical occurrence of spills with the amount of oil transported. Data on historical tanker spills over 100 tonnes was extracted from the ITOPF database of oil spills, and data on laden oil tanker shipments for the years 2001 and 2005 was obtained from Lloyds Marine Intelligence Unit (LMIU). The oil tanker shipments data was digitised using a GIS in order to display the information geographically; the result is a schematic showing the cumulative voyages in any specific region which illustrates traffic density and total volume of cargo. In addition, interpretation and comparison of data from 2001 and 2005 has enabled an assessment of the changing patterns in transportation of oil by sea and consequently, the changing risk. The GIS platform has proved a powerful tool for visualising the tanker voyages, and integrating datasets such as location of historical spills and environmentally sensitive areas.
Category: Papers