Oil Tanker Spill Statistics 2025
Background
ITOPF maintains a database of oil spills from tank vessels, including combined carriers, FPSOs and barges. This contains information on accidental spillages of persistent and non-persistent hydrocarbon oil since 1970, except those resulting from acts of war. The data held includes the location and cause of the incident, the vessel involved, the type of oil spilled and the spill amount.
Spills are categorised by size, <7 tonnes or <50 bbls (small), 7-700 tonnes or 50-5,000 bbls (medium) and >700 tonnes or >5,000 bbls (large), although the actual amount spilled is also recorded. Information is now held on over 10,000 incidents, the vast majority of which fall into the smallest category, i.e. <7 tonnes.
Information is gathered from published sources, such as the shipping press and other specialist publications, as well as from vessel owners, their insurers and from ITOPF's own experience at incidents. Historically, information from published sources mostly related to large spills, often resulting from collisions, groundings, structural damage, fires or explosions. In recent decades, however, reporting of smaller spills has improved.
Important information
It should be noted that the figures for the amount of oil spilled in an incident include all oil lost to the environment, including that which burnt or remained in a sunken vessel. There is considerable annual variation in both the incidence of oil spills and the amounts of oil lost. While we strive to maintain precise records for all spill information, we cannot guarantee that the information taken from the shipping press and other sources is complete or accurate. The number of incidents and volumes of oil spilled are recorded based on the most up to date information. From time to time, data is received after publication and, in which case, adjustment to previous entries may be made.
We regret that it is not possible to provide direct access to our database or to release the names of individual tanker incidents (unless already in the public domain).
Number of oil spills from tankers in 2025
For the year 2025, three large spills (>700 tonnes) and three medium spills (7-700 tonnes) were recorded from tanker incidents.
The three large spills involved crude and fuel oil, and occurred in Asia and Europe.
The three medium spills also involved crude and fuel oil; these all occurred in Asia.
This brings the decade average to date to 7 spills per year. This is a slight increase on the average for the 2010s, but a dramatic reduction from the numbers reported in earlier decades.
(This data relates to spills with confirmed volumes and does not include incidents resulting from acts of war.)
Quantity of oil spilled from incidents in 2025
The total volume of oil lost to the environment from tanker spills in 2025 was approximately 4,000 tonnes.
Global oil spill trend
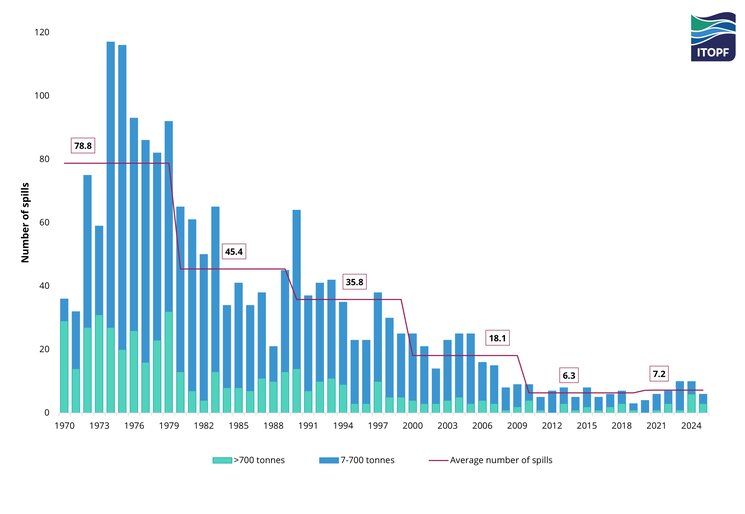
Spill frequency
Over the past half century, statistics for the frequency of spills greater than 7 tonnes from tankers have shown a marked downward trend, as illustrated in Figure 1 below.
Spills in excess of 7 tonnes have reduced by over 90% since the 1970s. There has however been little change in the last decade.
It is interesting to note the progressive reduction in the number of spills when data is analysed per decade, as demonstrated in Figure 2 below.
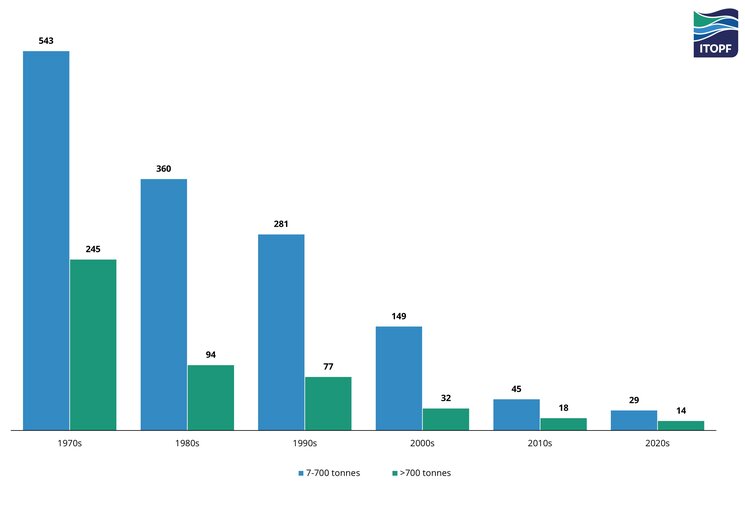
* Only six years of data available for the 2020s.
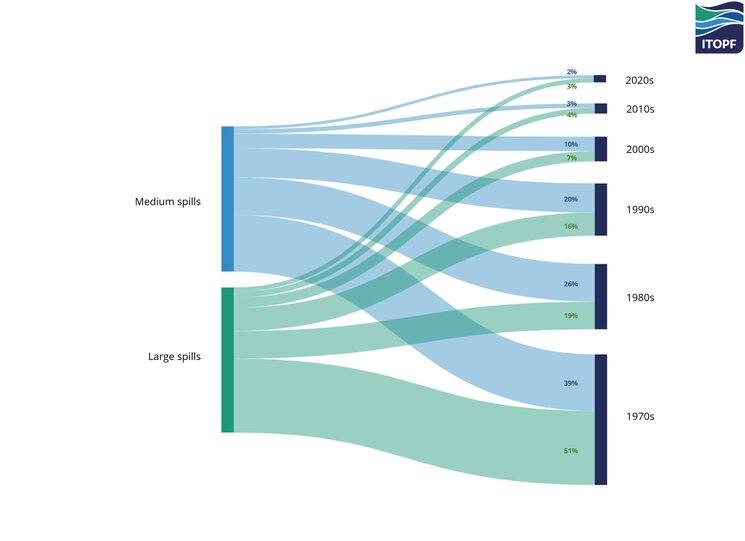
A quarter of all spills recorded over 7 tonnes are large (>700 tonnes). More than half of these large spills (51%) occurred in the 1970s (see Figure 3 below).
Tanker spills vs seaborne oil trade
While increased tanker movements might imply increased risk, it is encouraging to observe that the downward trend in oil spills continues despite an overall increase in oil trading over the period, as illustrated below (Figure 4).
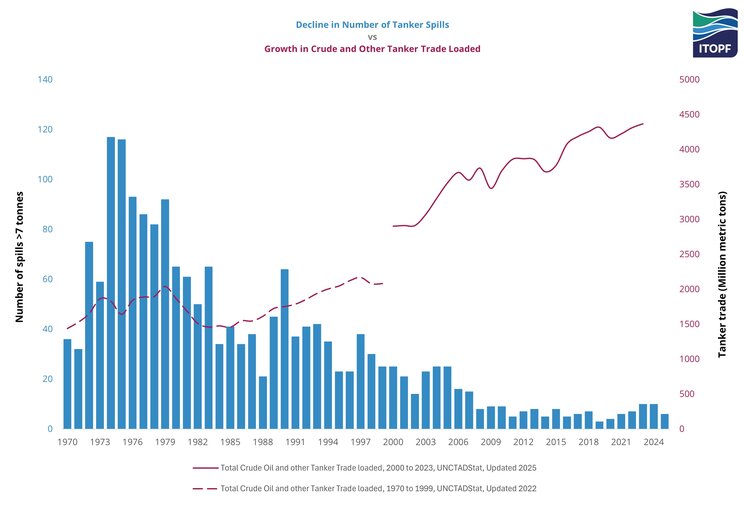
*UNCTADStat data is from two datasets and only available up to 2023.
Spill quantity
Alongside the reduction in spill frequency, there has been a significant decrease in the quantity of oil spilled through the decades. In the 2010s, approximately 164,000 tonnes of oil were lost from tanker spills of 7 tonnes and above, a 95% reduction since the 1970s. The figure for the present decade is currently 42,000 tonnes (six years of data).
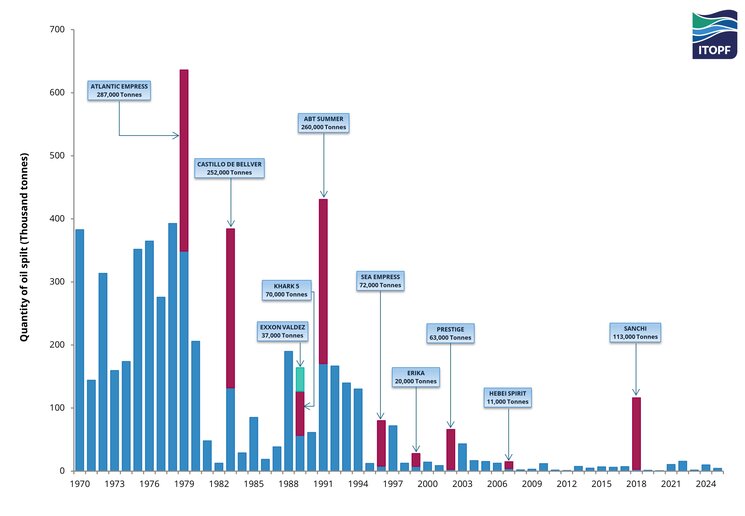
In terms of the volume of oil spilled, the figures for a particular year may be severely distorted by a single large incident (see Figure 5 below). This is clearly illustrated by incidents such as ATLANTIC EMPRESS (1979), 287,000 tonnes spilled; CASTILLO DE BELLVER (1983), 252,000 tonnes spilled; ABT SUMMER (1991), 260,000 tonnes spilled and SANCHI (2018), 113,000 tonnes spilled.
Frequency & quantity by decade
When the frequency and quantity of oil spilled are reviewed together, the influence of a few very large spills on the estimated quantities per decade can be seen (see Figure 6):
- In the 1990s, there were 358 spills of 7 tonnes and over, resulting in 1,134,000 tonnes of oil lost; 73% of this amount was spilled in just 10 incidents.
- In the 2000s, there were 181 spills of 7 tonnes and over, resulting in 196,000 tonnes of oil lost; 75% of this amount was spilled in just 10 incidents.
- In the 2010s, there were 63 spills of 7 tonnes and over, resulting in 164,000 tonnes of oil lost; 91% of this amount was spilled in just 10 incidents. One incident was responsible for about 70% of the quantity of oil spilled.
- In the 2020s to date, there have been 43 spills of 7 tonnes and over, resulting in 42,000 tonnes of oil lost. 85% of this amount can be attributed to 10 large incidents and 15% to the remaining 33 incidents.
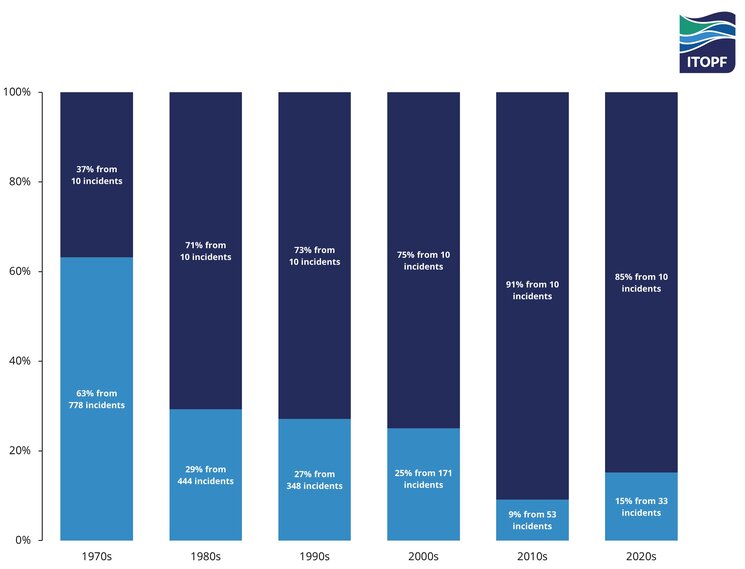
* Only six years of data available for the 2020s.
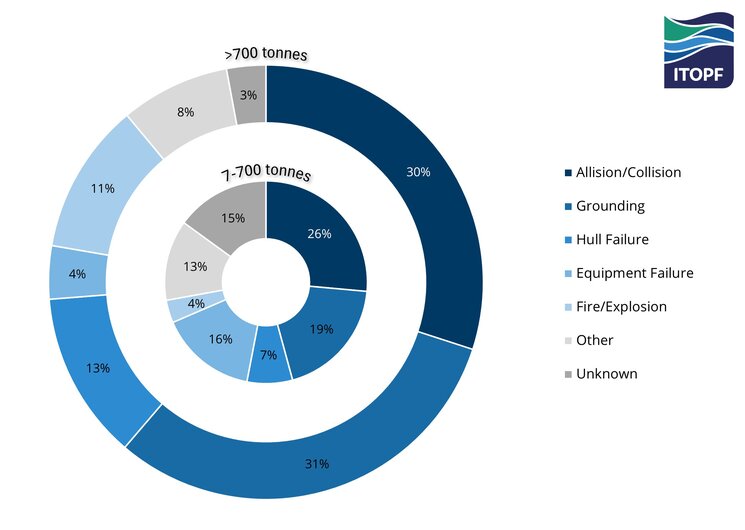
Causes of tanker spills
Most of the oil spills (>7 tonnes) recorded between 1970 and 2025 were caused by Allisions/Collisions and Groundings (see Figure 7).
In the 2020s, about a third of the spills recorded so far have been primarily caused by extreme weather events and human error, categorised as ‘Other’.
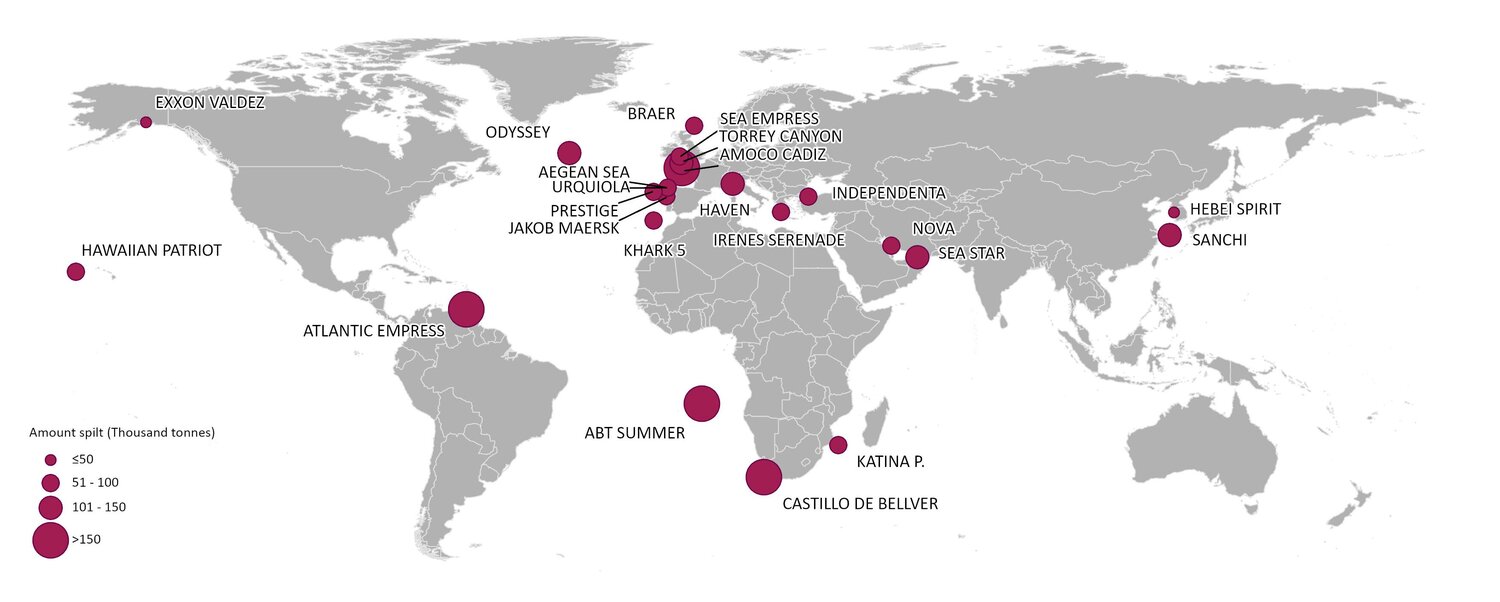
Major Oil Spills in History
A summary of the 20 largest tanker spills that have occurred since the TORREY CANYON in 1967 is given below. It is of note that 19 of the 20 largest spills recorded occurred before the year 2000. SANCHI, the latest addition to the list, is the only major spill of non-persistent oil featured here and it resulted in significantly lower environmental impacts compared to some crude oil spills listed.
A number of the incidents, despite their large size, necessitated little or no response as the oil was spilled some distance offshore and did not impact coastlines. For this reason some of the names listed may be unfamiliar.
PRESTIGE, EXXON VALDEZ and HEBEI SPIRIT are included for comparison although these incidents are further down the list.
Top 20 Major Spills Table
Position | Ship Name | Year | Location | Spill Size (tonnes) |
|---|---|---|---|---|
| 1 | ATLANTIC EMPRESS | 1979 | Off Tobago, West Indies | 287,000 |
| 2 | ABT SUMMER | 1991 | 700 nautical miles off Angola | 260,000 |
| 3 | CASTILLO DE BELLVER | 1983 | Off Saldanha Bay, South Africa | 252,000 |
| 4 | AMOCO CADIZ | 1978 | Off Brittany, France | 223,000 |
| 5 | HAVEN | 1991 | Genoa, Italy | 144,000 |
| 6 | ODYSSEY | 1988 | 700 nautical miles off Nova Scotia, Canada | 132,000 |
| 7 | TORREY CANYON | 1967 | Scilly Isles, UK | 119,000 |
| 8 | SEA STAR | 1972 | Gulf of Oman | 115,000 |
| 9 | SANCHI | 2018 | Off Shanghai, China | 113,000 |
| 10 | IRENES SERENADE | 1980 | Navarino Bay, Greece | 100,000 |
| 11 | URQUIOLA | 1976 | La Coruna, Spain | 100,000 |
| 12 | HAWAIIAN PATRIOT | 1977 | 300 nautical miles off Honolulu | 95,000 |
| 13 | INDEPENDENTA | 1979 | Bosphorus, Turkey | 94,000 |
| 14 | JAKOB MAERSK | 1975 | Oporto, Portugal | 88,000 |
| 15 | BRAER | 1993 | Shetland Islands, UK | 85,000 |
| 16 | AEGEAN SEA | 1992 | La Coruna, Spain | 74,000 |
| 17 | SEA EMPRESS | 1996 | Milford Haven, UK | 72000 |
| 18 | KHARK 5 | 1989 | 120 nautical miles off Atlantic coast of Morocco | 70,000 |
| 19 | NOVA | 1985 | Off Kharg Island, Gulf of Iran | 70,000 |
| 20 | KATINA P | 1992 | Off Maputo, Mozambique | 67,000 |
| 21 | PRESTIGE | 2002 | Off Galicia, Spain | 63,000 |
| 36 | EXXON VALDEZ | 1989 | Prince William Sound, Alaska, USA | 37,000 |
| 132 | HEBEI SPIRIT | 2007 | South Korea | 11,000 |