Visualising spill risk: Understanding and assessing regions of heightened vulnerability associated with increased seaborne transport of oil (2015)
2 April 2015
Lisa Stevens, Technical Support Coordinator
Poster presented at INTERSPILL 2015, 24-26 March 2015, Amsterdam
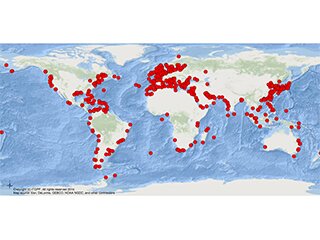
Understanding and assessing the risk posed by oil spills is an essential starting point in oil spill prevention, preparedness, and response. However, it is a complex process and displaying results of a risk analysis can be particularly challenging. By modelling and analysing volumes of oil transported globally over a ten year period from 2001 to 2011, using data obtained from Lloyd's List Intelligence and historical data from ITOPF's tanker spills database, an informative and useful representation of risk can be derived. Incorporation of local marine sensitivity data into the model can further improve the risk assessment process.
Although there has been a significant increase in seaborne oil trade over the last thirty years and this is predicted to continue for the foreseeable future, the number of accidental oil spills involving tankers is continuing to decline. GIS tools such as the one we describe are an important part of focussing the on-going efforts of government and industry. These tools can help build awareness of the risks through training courses and seminars and by developing regional initiatives in those areas where they can provide greatest benefit to minimise the threat of future incidents.
This poster shows how by using a GIS platform to graphically visualise information, regional areas of heightened vulnerability are more effectively identified and communicated.
Category: Papers